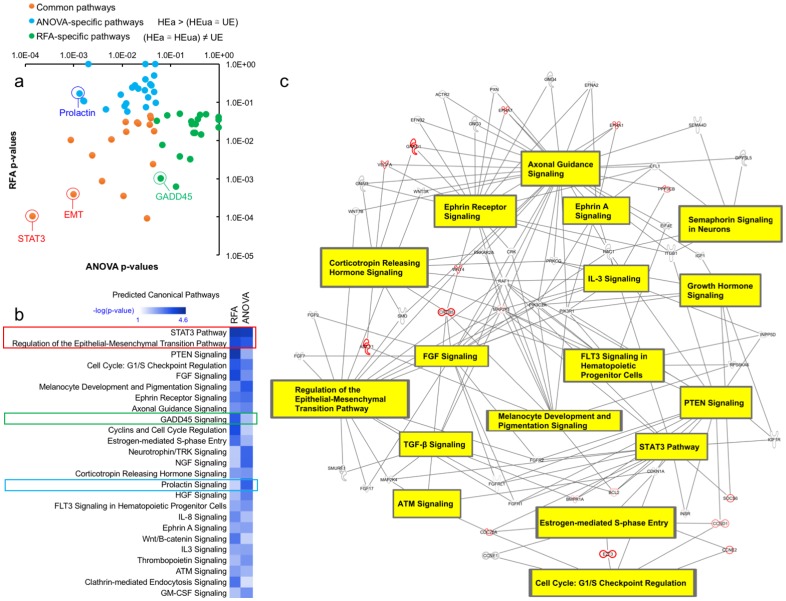
Fig 5. Pathway overrepresentation analysis to assess functions of predictive plasma miRNAs.
Pathway overrepresentation analysis was performed using IPA software on targets of the eleven miRNAs that exceeded the FDR-corrected ANOVA criterion of P<0.05 (HEa>(HEua ≅ UE), and the five unique miRNAs among the top 10 contributory variables by random forest analysis ((HEa ≅ HEua)≠UE). (a) The -log10 p-values of significantly enriched pathways (P < 0.05) for both the ANOVA model and the RFA model were plotted against each other with transformed significance values for pathways exclusively enriched among the ANOVA model depicted in blue, the RFA model in green, and pathways enriched in both the RFA and ANOVA models in red. (b) A heat map was constructed of the top 25 significantly enriched pathways among the RFA and ANOVA models. (c) The 17 pathways enriched among both the RFA and ANOVA model share a high degree of interconnectedness. Proteins outlined in red indicate overlapping targeting by miRNAs in both the RFA and ANOVA models.

