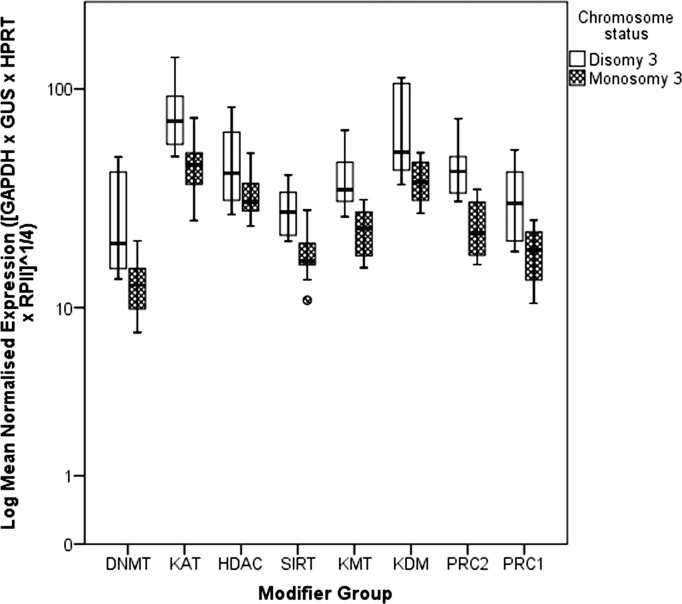
Figure 2.
Box plot comparing expression of different modifier groups with the mean normalized expression of four household genes, between D3 (n = 8) and M3 (n = 12) tumor samples in the test set. Quantitative PCR was performed on each of 20 UM samples to amplify 59 genes, along with four household genes for each individual test gene. The mean of the Ct values for four household genes was compared with the Ct value of the test gene. Here, 59 genes have been categorized into eight modifier groups for analysis. Significant differences in expression (P < 0.05) of the modifier groups KAT, SIRT, KMT, and PRC2 between D3 and M3 tumors were found.

