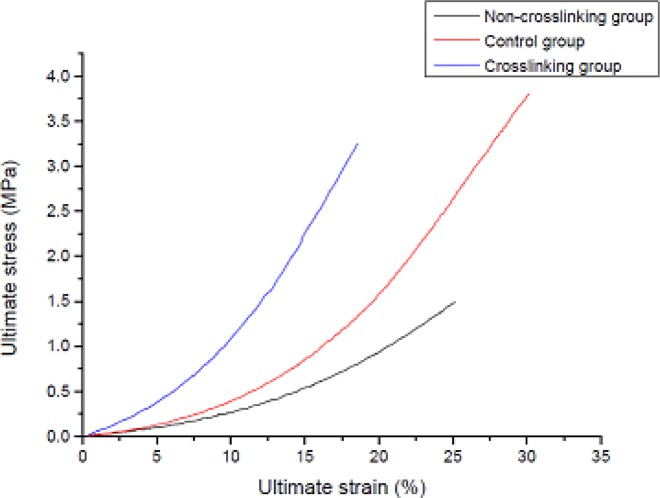
Fig 10. Stress-strain curve of the tensile test.
Three curves were chosen randomly from each of the three groups in this study. Ultimate stress of the sclera was lowest in the NCL group followed by the CL group and the control group; Ultimate strain (%) of the sclera was lowest in the CL group followed by the NCL group and the control group.

