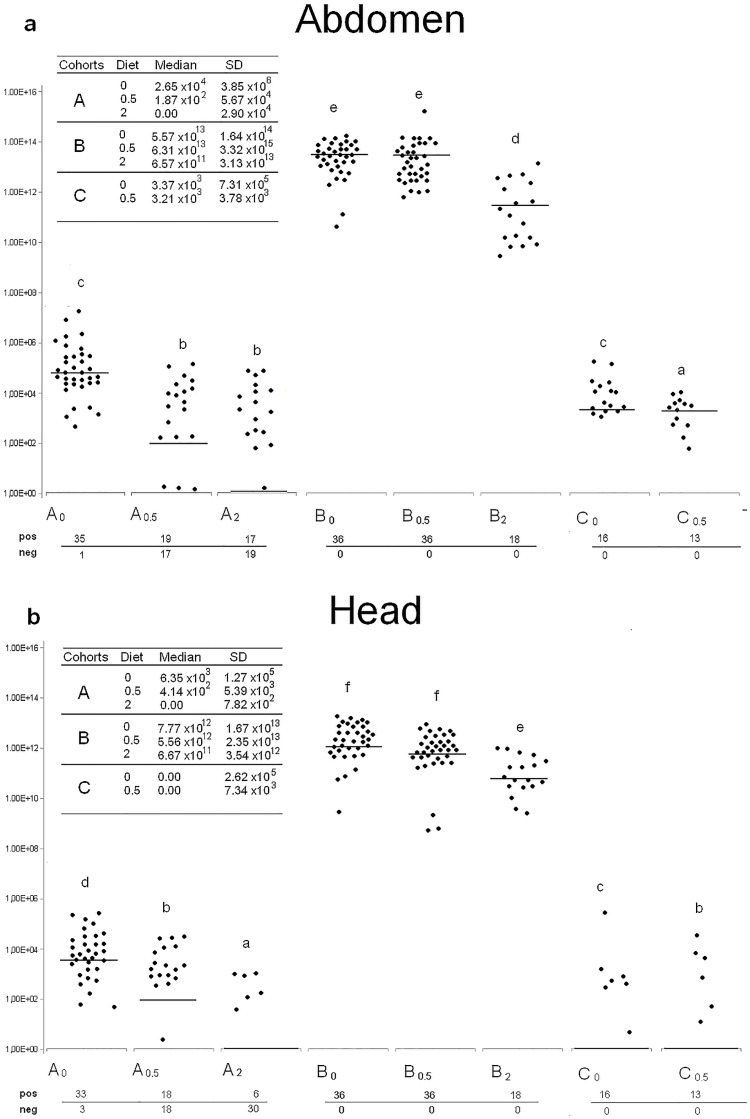
Fig 2. DWV viral load.
Viral load values of individual abdomens (a) and heads (b) are shown for cohort A, B and C respectively. Median and standard deviation values are shown in the box. Black dots (●) represent individual DWV viral load values per μg of RNA. Horizontal lines indicate the median. Different letters on top of boxplot indicate statistically significant differences among groups (p<0.01). Number of positive and negative samples within each experimental group are shown.

