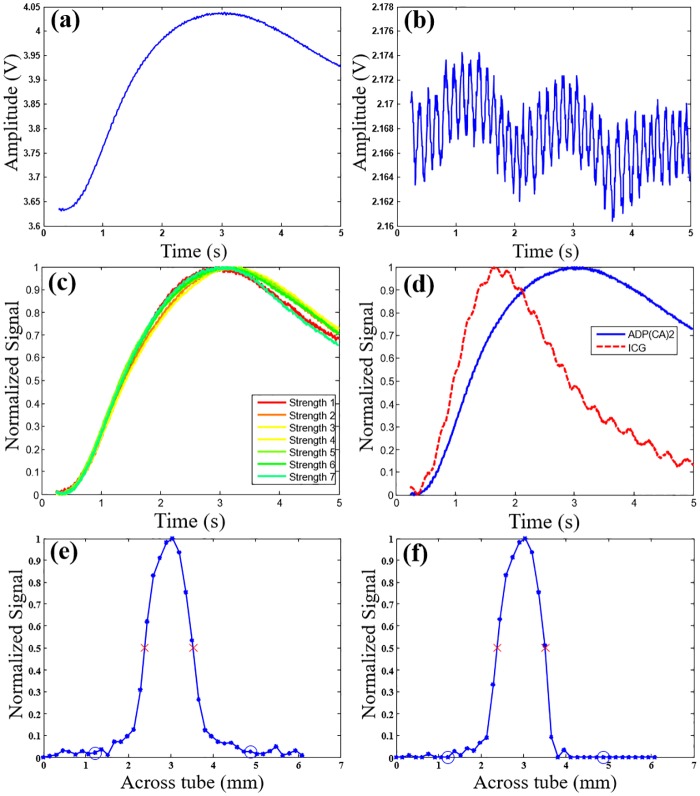
Fig 3. Typical USF signals and the correlation method.
(a) and (b) show the typical USF signal and background noise acquired from ADP(CA)2-encapsulated Pluronic-F127 nanocapsules in the 8-mm thick tissue USF experiment, respectively. (c) The normalized USF signals (from ADP(CA)2-based agents) with different signal strengths (strength 1–7: 171, 239, 290, 310, 325, 306, and 270 mV, respectively) to show that the shape is independent of the signal strength. Different signal strengths were generated by varying the HIFU driving voltage. (d) The normalized USF signals from ADP(CA)2-encapsulated Pluronic-F127 nanocapsules (blue solid line) and ICG-encapsulated PNIPAM NPs (red dash line) agents to show that the shape is dependent on the type of the agents. (e) and (f) are the normalized USF profiles of the micro-tube (filled with the ADP(CA)2-based agent) before (SNR: 88) and after (SNR: 300) correlation analysis, respectively. The experiment conditions are presented in Methods.

