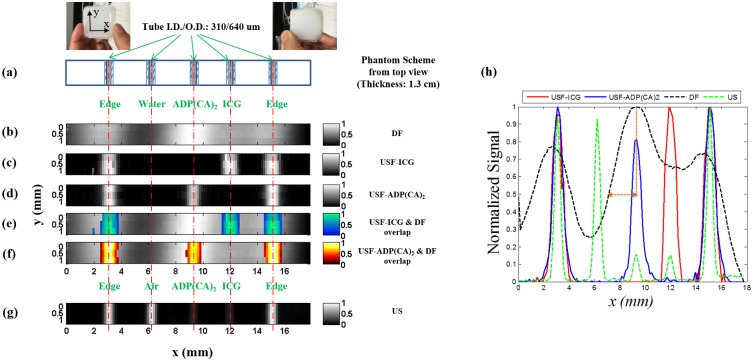
Fig 4. Images of micro-tubes in a tissue-mimic phantom.
(a) The photographs and schematic diagram of the tissue-mimic silicone phantom (on x-y plane): front view (left photo), back view (right photo) and the cross section of the micro-tube structure on the x-y plane (the bottom figure in (a)). (b) The image acquired by directly detecting fluorescence (DF) without ultrasound. (c) and (d) show the USF images acquired from ICG-encapsulated PNIPAM NPs (color-1) and ADP(CA)2-encapsulated Pluronic-F127 nanocapsules (color-2), respectively. (e) and (f) are the overlapped images between USF images ((c) and (d)) and direct fluorescence image (b). (g) Ultrasound image of the micro-tubes acquired from the same ultrasound transducer (i.e. a C-mode ultrasound image). The three non-edge tubes (the second, third, and fourth tubes) were filled with water (as background control), ICG-based agent (color-1) and ADP(CA)2-based agent (color-2), respectively. The two edged micro-tubes (the first and fifth tubes) were used for image co-registration and were filled with the corresponding contrast agent of each modality (see Methods). (h) The normalized profiles along x-axis acquired from different imaging modalities (i.e. the cross section of the five micro-tubes in the silicone phantom). Due to the significant overlap of the tube profiles in the DF image, the two dotted brown lines are used to show how FWHM of the central tube in the DF image (the dashed black line) is estimated. The horizontal dashed brown line with double arrows represents ½ of the FWHM that is ~2.5 mm and therefore the estimated FWHM is ~5 mm.

