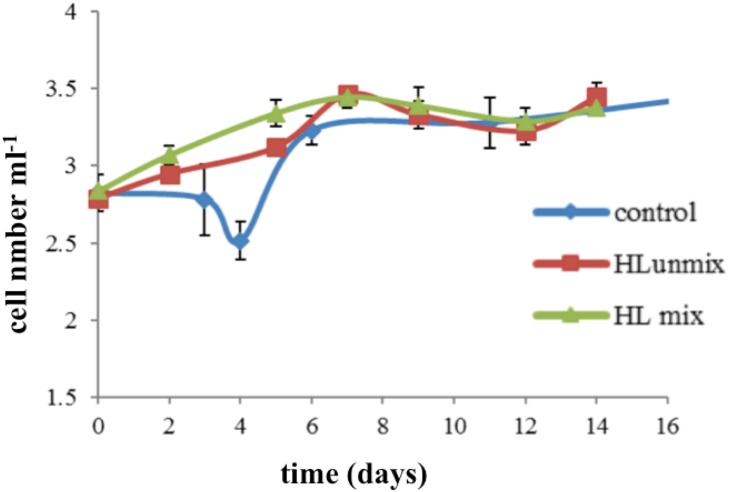
Fig 1. Growth curves.
For the three culture conditions tested growth curves were registered over the 16 day experiments. Cell concentration is calculated as the mean value of the three culture replicates set for each growth conditions and expressed as log10 cells mL-1. Standard deviations of the mean values are reported.

