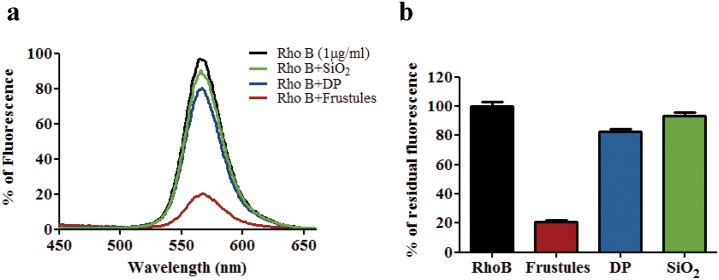
Fig 6. Fluorescence analyses of the Rho B binding to the frustules.
a) Fluorescence of 5 μg/ml of Rho B solution after incubation at different frustules/Rho B w/w ratios: 0, 10, 25, 50 and 100, in 10 mM Tris-HCl, 8.0 pH, buffer. λex at 556 nm and λem from 450 to 680 nm; b) 50 μg/ml of Rho B solution after 30 min of incubation with 0.5 mg of frustules and centrifugation; c) Plot analysis of the % of fluorescence variation (% (Fo-F)/F0) of the Rho B solution at 566 nm after incubation at different frustules/Rho B w/w ratios; bars represent SD values; d) Fluorescence micrograph of the frustules after incubation with 10 μg/ml Rho B and washing; scale bar 10 μm.

