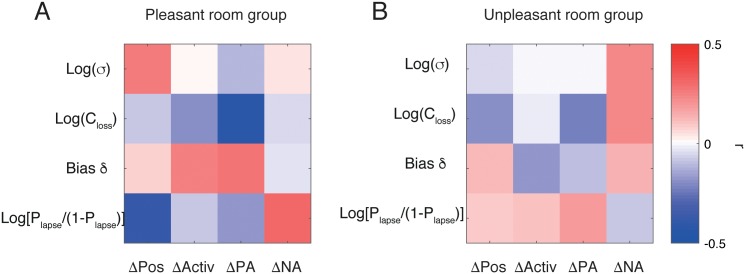
Fig 8. Correlations between estimated parameters and the changes in questionnaire scores (affective measures).
A The Pleasant room participants. B. The Unpleasant room participants. The colour shows the correlation coefficient r, where blue means negative (r < 0) and red means positive (r > 0). The changes in score were computed as the score after Session 3 minus the score before Session 1. None of the correlations was significant after the multiple comparison correction.

