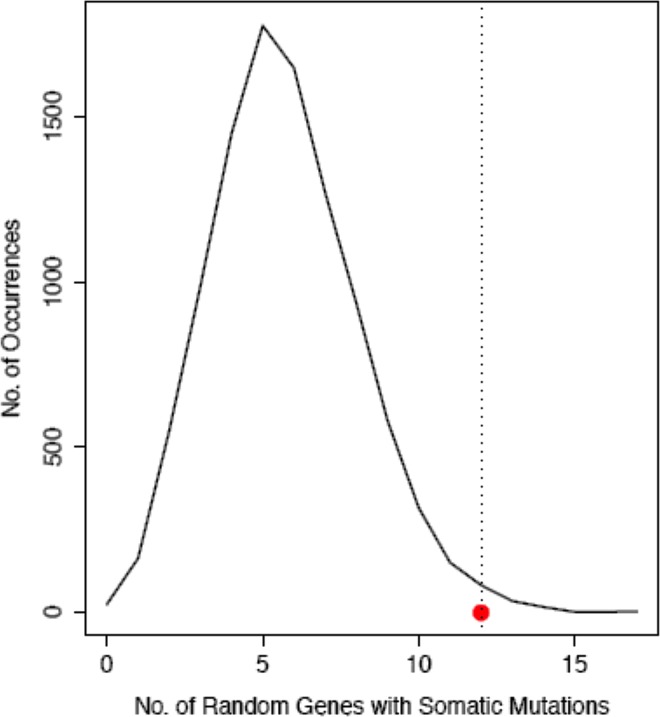
Fig 3. Randomization test for somatic mutations.
The curve represents the distribution of number of genes that belonged to the MAPK pathway in the 1000 sets of random genes. The mean of the data set is 5.7 somatic mutations in 257 genes with a standard deviation of 2.34. The red dot along the X-‐axis depicts a value of 12 –the number of MAPK genes having somatic mutations. The P-value was calculated based on the number of random sets that had less than 12 genes belonging to MAPK pathway. The number of somatic mutations observed in MAPK pathway is significantly higher than the mean (P = 0.0046).

