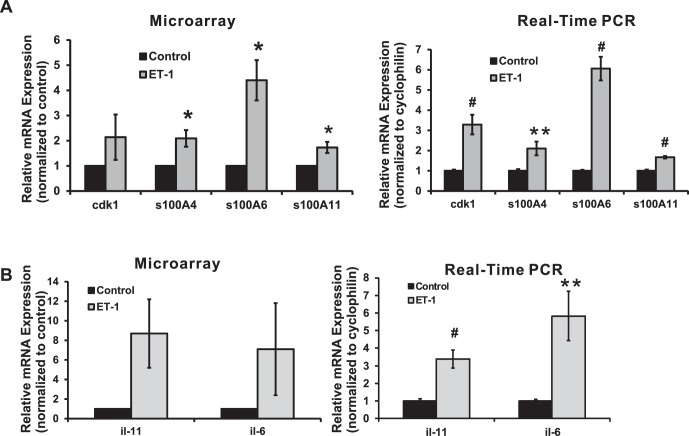
Figure 1.
Calcium-associated genes, cdk1, and interleukins in response to ET-1 treatment in RGCs. Expression levels of genes were detected by microarray and real-time PCR using cDNA template synthesized from total RNA, which was extracted from RGCs following ET-1 treatment. (A) Expression of cdk1 and S100 family genes was detected by microarray and real-time PCR. An increased expression of 2.1-, 4.4-, and 1.7-fold in ET-1 treatment was detected in microarray for s100A4, s100A6, and s100A11, the same trend also was observed as an increase of 2.1-fold (n = 6, t-test, P = 0.01), 6.1-fold (n = 12, t-test, P ≤ 0.001), and 1.7-fold (n = 6, t-test, P ≤ 0.001) from real-time PCR, respectively (A). Statistical analysis was performed using t-test. (*P < 0.05, **P ≤ 0.01, #P ≤ 0.001). (B) Interleukin-6 and il-11 were detected by microarray and real-time PCR. Statistical analysis was performed using t-test. (*P < 0.05, **P ≤ 0.01, #P ≤ 0.001). Endothelin-1 treatment of RGC induced a 7.1- and 8.7-fold increase of il-6 and il-11 in microarray, although there was a large variation detected from three sets of data (B); real-time PCR confirmed this significant upregulation of mRNA level for il-6 and il-11 at 5.8- and 3.4-fold with t-test P < 0.01 (both with n = 12; relative mRNA levels (mean ± SEM) are represented in bar graph; in microarray, the vehicle control served as control; in real-time PCR, results were normalized to the expression of cyclophilin A, and values were compared to the vehicle-treated control cells).

