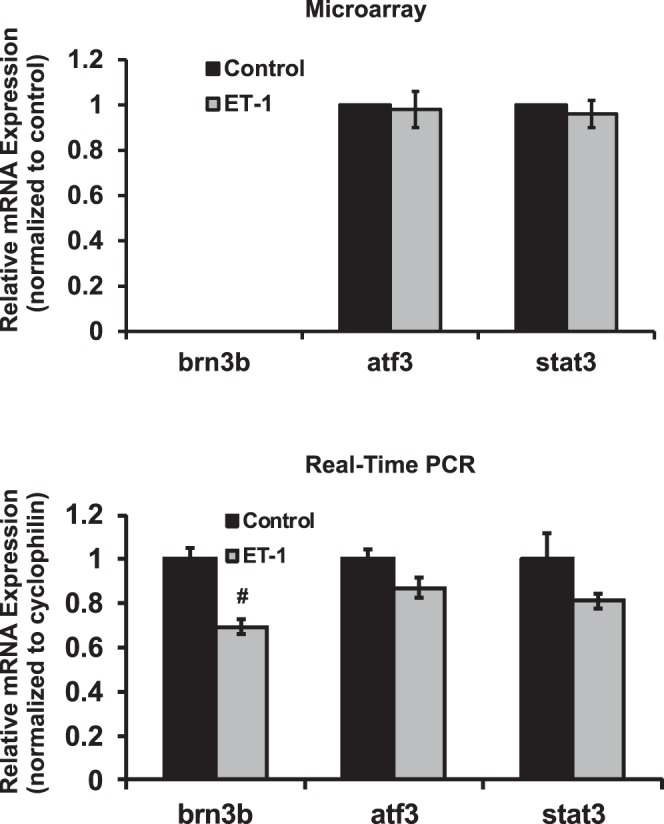
Figure 5.

Expression of transcription factors brn3b, atf3 and stat3 in RGCs treated with ET-1. ET-1 treatment in RGCs decreased the expression of brn-3b to 70% of control in real-time PCR (P < 0.001, n = 6, t-test) and no data were obtained for brn-3b because of no hybridization oligos in microarray chip. There were no significant changes of atf3 and stat3 detected in ET-1–treated RGCs using microarray. *P < 0.05, **P ≤ 0.01, #P ≤ 0.001; mRNA levels (mean ± SEM) are represented in bar graph; in microarray, the vehicle control served as normalization control; in real-time PCR, results were normalized to the expression of cyclophilin A, and then compared to vehicle-treated control cells.
