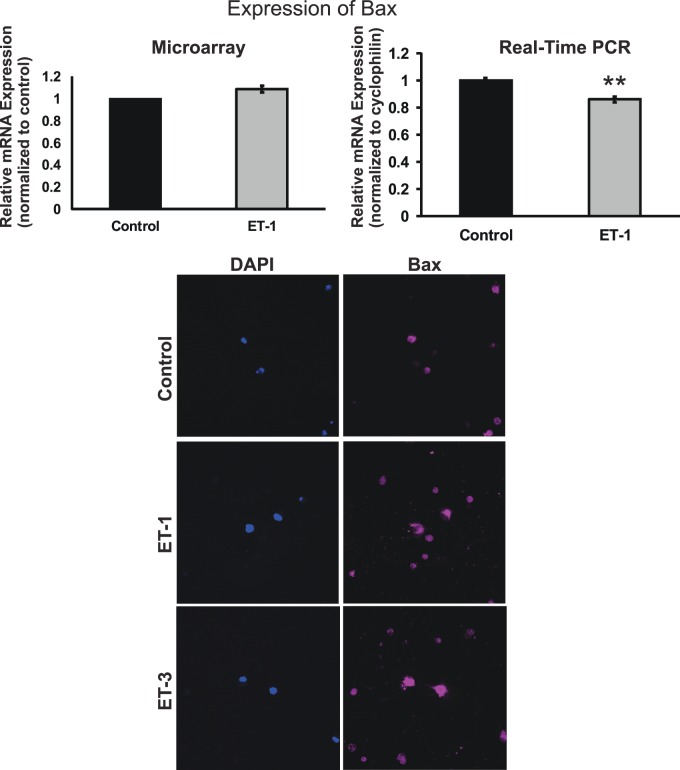
Figure 8.
Messenger RNA and protein levels of Bax in RGCs. There was no change in the mRNA levels of bax detected in ET-1–treated RGCs from microarray, but a decrease to 86% of control was observed in ET-1–treated RGCs by real-time PCR, which was statistically significant (P = 0.001, t-test, n = 6). Endothelin-1 or ET-3 treatment in RGC boosted the protein level of Bax, the staining intensity of Bax was higher in ET-treated group compared to control (*P < 0.05, **P < 0.01, #P < 0.001); mRNA levels (mean ± SEM) are represented in bar graph; in microarray, the vehicle control served as control; in real-time PCR, results were normalized to the expression of cyclophilin A, and values were compared to vehicle-treated control cells.

