
Fig. 2.
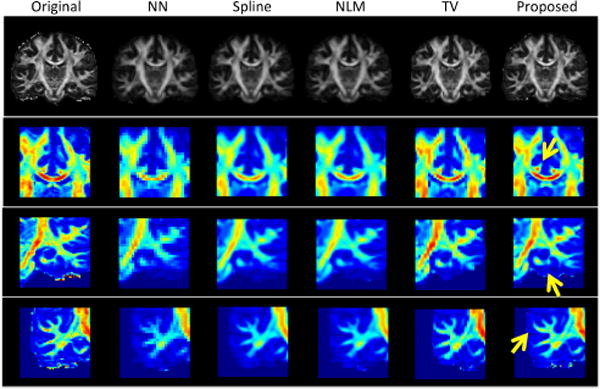
Illustration of FA maps of a typical subject, as well as close-up views of color-coded FA maps in three brain regions. Red indicates high FA value, and blue indicates low FA value.
Official websites use .gov
A
.gov website belongs to an official
government organization in the United States.
Secure .gov websites use HTTPS
A lock (
) or https:// means you've safely
connected to the .gov website. Share sensitive
information only on official, secure websites.
Illustration of FA maps of a typical subject, as well as close-up views of color-coded FA maps in three brain regions. Red indicates high FA value, and blue indicates low FA value.