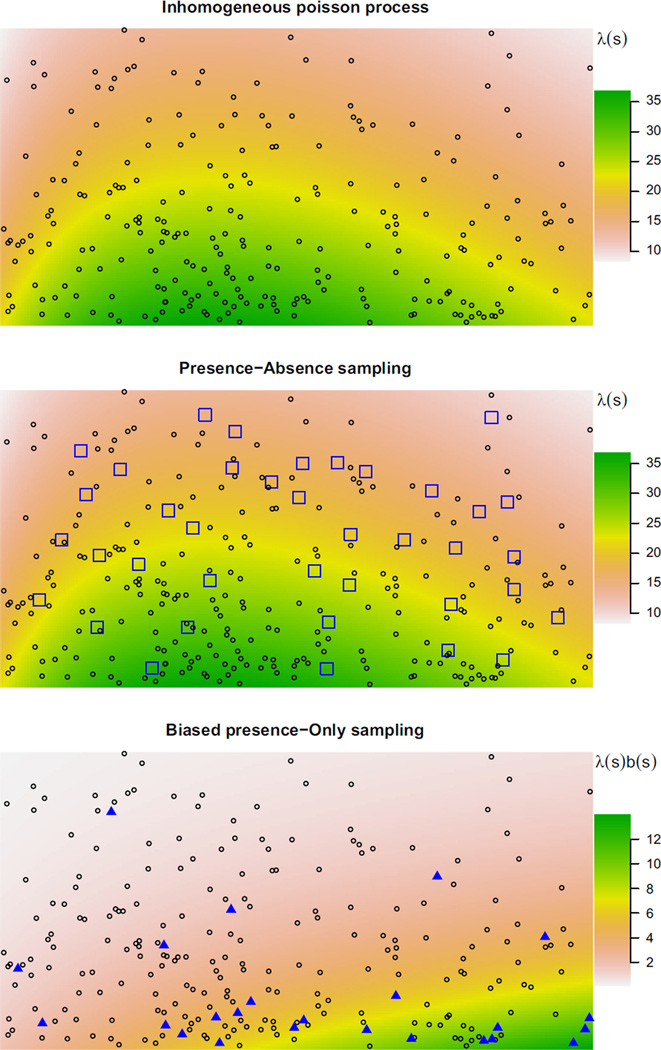
Fig. 1.
A Poisson process with two different sampling schemes representing our models for presence–absence and presence-only data. The top panel represents the species process against a heat map of the species intensity λ(s). The second panel depicts presence–absence or other systematic survey methods: quadrats (blue squares) are surveyed and organisms counted in each one. The third panel depicts biased presence-only sampling, with the blue triangles indicating the presence-only process, a small and unrepresentative subset of the species process. The heat map shows the presence-only intensity λ(s) · b(s).

