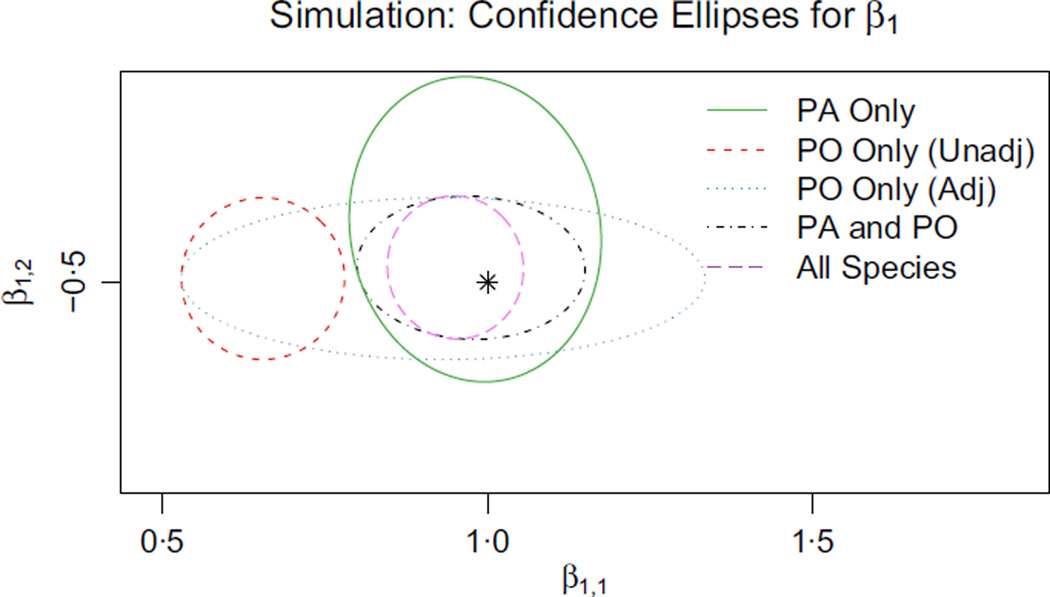
Fig. 3.
Ninety-five percent Wald confidence regions for β1, the species distribution coefficients for species 1, obtained by using five different methods. The plot illustrates the precision and accuracy with which the coefficients are estimated by each method. The black star denotes the true values of the parameters of interest. The different model types are described below: PA data alone (Green): The most straightforward method when PA data for species 1 is to maximize likelihood for it alone. Our estimates of both coefficients are unbiased but less precise than they could be. z plays no role in the PA data or our model for it, so the precisions for the two coordinates of β1 are about the same;PO data alone, no regression adjustment (Red): The most common use of presence-only data is to maximize likelihood using only the presence-only data for species 1, making no adjustment for sampling bias. In that case, we are effectively estimating the presence-only intensity instead of the species intensity. Here, x1 proxies for the confounding variable z and β̂1,1 is severely biased, whereas β̂1,2 is unaffected; PO data alone, with regression adjustment (Blue): We can address sampling bias by attempting to estimate the effect of the confounder z. Our estimates are now unbiased, but β̂1,1 is noisy and its interval is very wide. It is quite hard to tease apart the effects of x1 and z given only PO data; PA and PO data for species 1 (Black): The PO data carry solid information about β1,2, whereas the PA data carry the only usable information about β1,1. When we combine both data sources for species 1, the precision of β̂1,2 roughly matches the methods using PO alone (blue and red), and the precision of β̂1,1 matches the method using PA alone (green); Pooled data for all species (Purple): We obtain the best results by pooling both presence–absence and presence-only data sets for many different species. Species 2,3,…,m all contribute to estimating δ to high precision. As a result, the presence-only data for species 1 becomes much more useful for estimating β1,1, because we know how to correct for the sampling bias.

