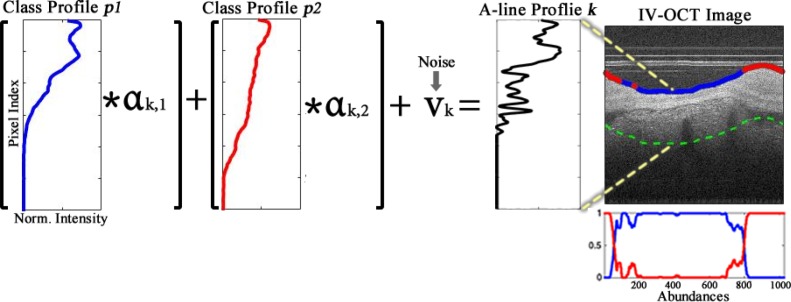
Fig. 1.
Illustration of the k-th A-line profile (black) being modeled as the linear combination of two main profiles (p1 in blue and p2 in red) each with corresponding abundances (αk,1, αk,2) for that particular A-line, plus a noise component vk. The color on the lumen of the OCT image indicate the most dominant class at that specific A-line. The dotted green line marks the maximum depth considered for the profile in the region of interest. The right-bottom plot depicts the abundances of both profiles at each A-line.

