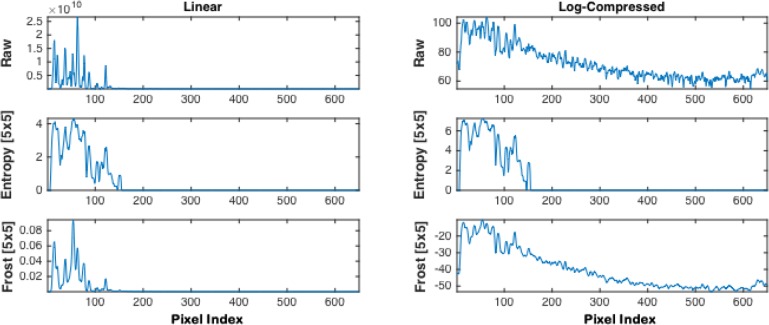
Fig. 5.
Comparison of an A-line signal after the Entropy and Frost filters were applied using a window size of 5 × 5. The first column shows the linear signal, while the second column shows the log-compressed version. The raw Linear and Log-compressed signals are plotted as reference in the first row, the second row shows the Entropy filtered A-line, and the third row depicts the Frost filtered version.

