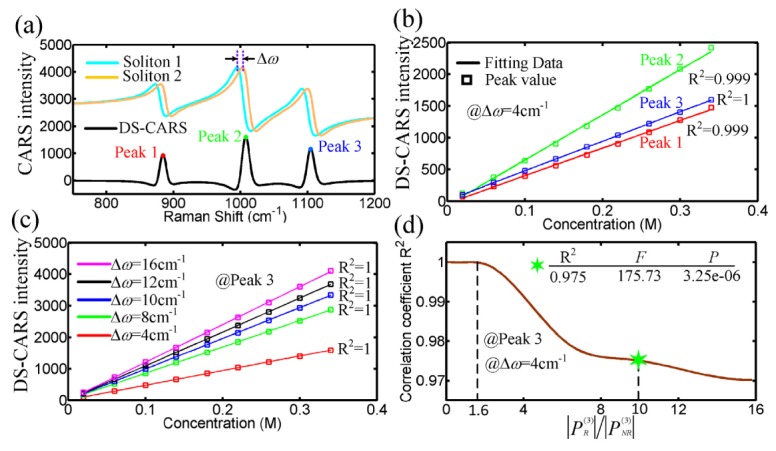
Fig. 3.

(a) DS-CARS spectrum (black) with three peaks is obtained from the difference of the two simulated CARS signals by soliton 1 and 2. (b) and (c) Simulated effect of peak location of DS-CARS (b) and spectral separation of the dual-soliton (c) on the linear correlation between Peak intensity and concentration of dilute analytes. (d) The correlation coefficient R2 against the ratio of resonant and nonresonant contribution. The marker (green hex star) represents a nonresonant contribution about 100 times weaker than the resonant contribution. F = the F-test value, P = statistical significance.
