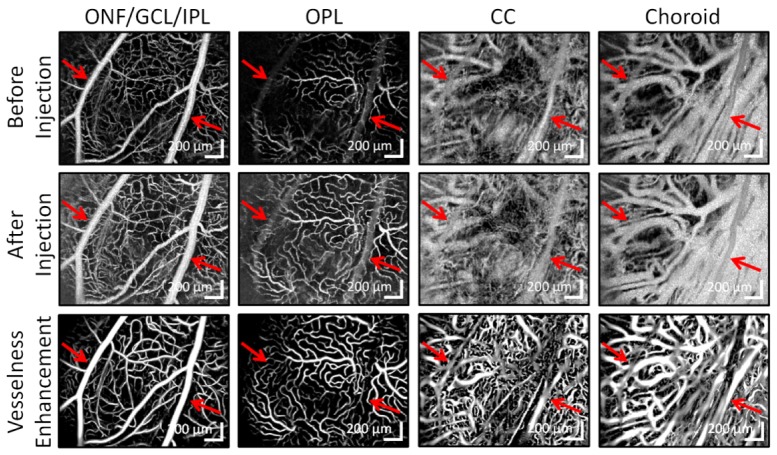
Fig. 4.
Maximum intensity projection angiograms across 4 vascular layers before contrast injection, after contrast injection (contrast-enhanced), and after applying the vesselness enhancement algorithm to the contrast-enhanced angiogram. Each pair of before and after angiograms in the same column have the same color scale. Red arrows point to large retinal vessels and the shadows that they cast in subsequent layers.

