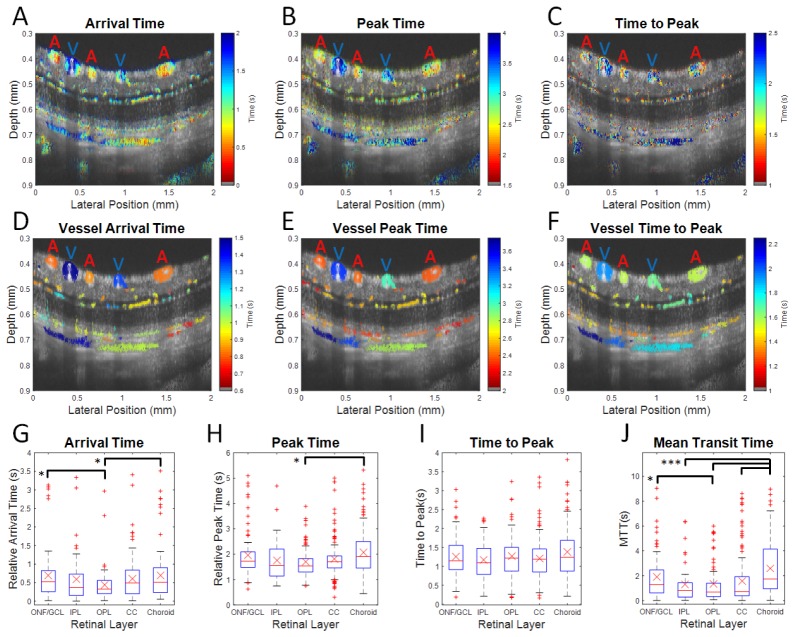
Fig. 5.
DyC-OCT measures laminar transit time kinetics. False color transit time maps are overlaid on grayscale structural OCT images with large arteries and veins marked (A and V respectively) at both the voxel level (A-C) and the vessel level (D-F). Statistics from vessels across 4 rats are shown (G-J). Metrics are arrival time (A,D, and G), peak time (B,E, and H), time to peak (C,F, and I), and mean transit time (J). The arrival and peak times shown in the first two rows are relative to the imaging start time. In the third row, the ONF/GCL, IPL, and OPL arrival and peak times are referenced, for each rat, to the earliest inner retinal arterial arrival time, while the CC and choroid arrival and peak times are similarly referenced to the earliest choroidal arterial arrival time. Medians (red lines) and means (red X’s) for each layer, with equal weighting for each vessel, are shown. The upper and lower quartile ranges are bounded by the blue box. Outliers (red points) fall outside of 2.5 times the upper or lower quartile range. The maximum and minimum points (dashed black lines), excluding outliers, are shown. Black bars show statistically significant pairwise comparisons (* p < 0.05 and *** p < 0.0005). ONF/GCL – Optic Nerve Fiber/Ganglion Cell Layer, IPL – Inner Plexiform Layer, OPL – Outer Plexiform Layer, and CC – Choriocapillaris.

