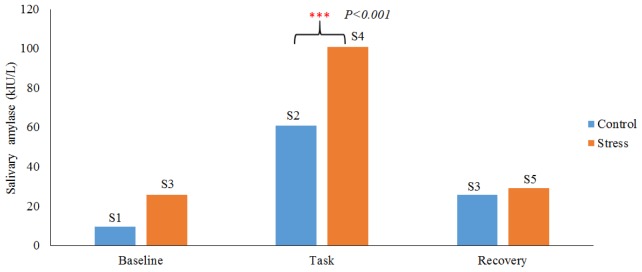
Fig. 3.
Salivary alpha amylase responses under control and stress condition. Blue color shows the salivary alpha amylase response under control condition at three measurement instances (5 min before (baseline), at the end of control condition (Task), 5 min after the task (recovery). Red colour shows the salivary alpha amylase response under stress condition with three measurement times (5 min before (baseline), at the end of stress condition (Task), 5 min after the stress task (recovery).The marks “***” indicate that, the task is significant with p<0.001.

