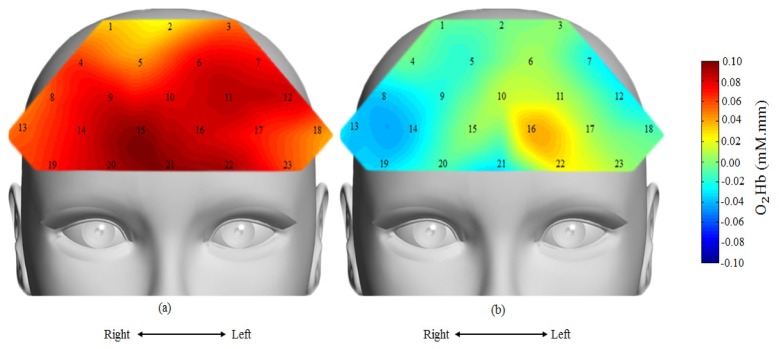
Fig. 6.
Topographical map of oxygenated hemoglobin activation for average of 22 subjects, (a) under control condition and (b) under stress condition. Red colour indicates higher activation and blue colour indicates less activation. Under stress condition, reduced hemodynamic response around the right PFC region.

