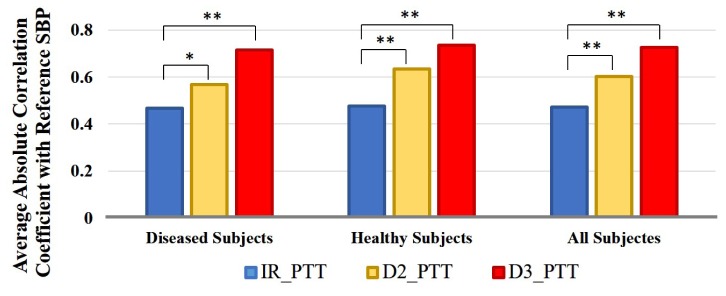
Fig. 8.
Bar plot of the average absolute correlation coeffcients between reference SBP and IR_PTT, reference SBP and D2_PTT, and reference SBP and D3_PTT on diseased subjects, healthy subjects and all subjects. ‘*’ represents the significance in difference is p<0.05 and ‘**’ represents the significance in difference is p<0.01.

