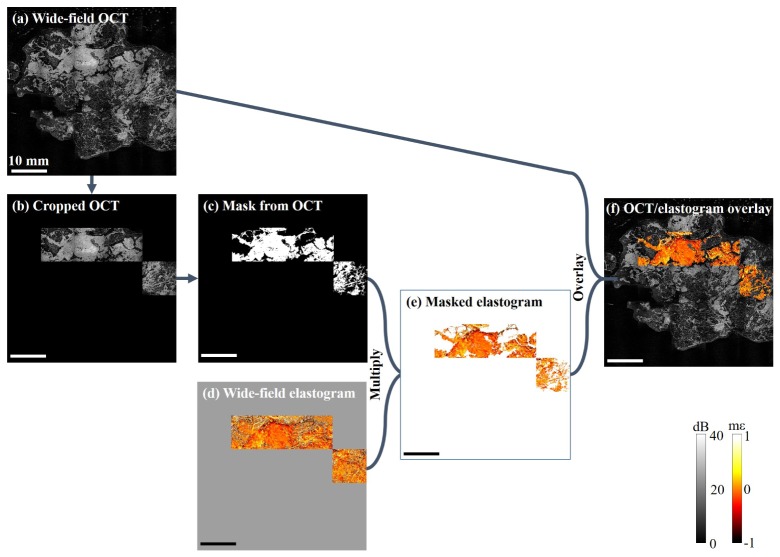
Fig. 3.
Illustration of the overlay process. (a) Wide-field OCT image. (b) Cropped OCT image, generated by combining (a) and (d). (c) Binary mask. (d) Unmodified wide-field elastogram. (e) Masked elastogram, generated by multiplying (c) and (d), (white area corresponds to transparent in the overlay). (f) Wide-field OCT/OCME, generated by overlaying (e) onto (a). Scale bar 10 mm.

