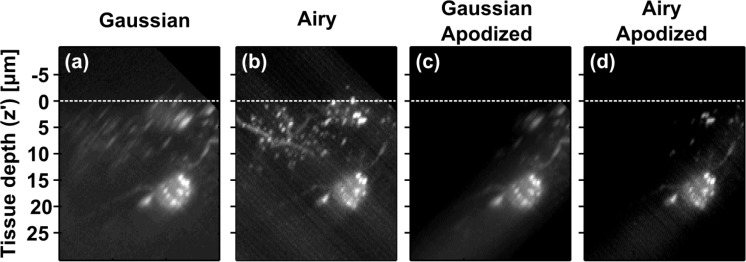
Fig. 2.
(a,b) Maximum intensity projections (x′ − z′ view) of fluorescent neurons in 400 μm thick, non-cleared mouse brain tissue section acquired using GLSM (a) and ALSM (b). Dashed white lines indicate tissue surface. (c,d) Apodized versions of (a,b) showing only the region around Gaussian beam focus which is used for analysis. This dataset can be accessed at [23].

