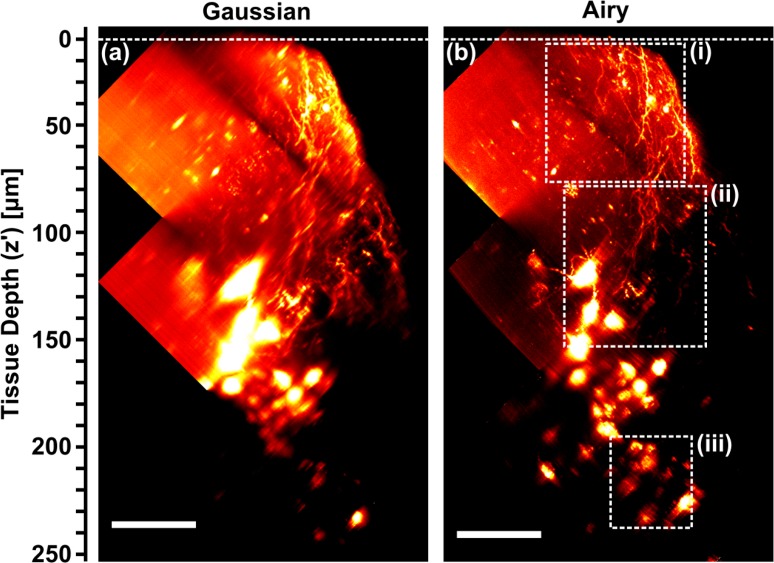
Fig. 4.
(a,b) Maximum intensity projections (x′ − z′ view) of fluorescent neurons in 400 μm thick, cleared mouse brain tissue section acquired using GLSM (a) and ALSM (b). Composite images of 3 datasets at different tissue depths. Dashed white lines indicate tissue surface. Cropped regions of (a,b) within dashed boxes (i–iii) indicate regions used for analysis in Fig. 5. Scale bar: 50 μm. This dataset can be accessed at [23].

