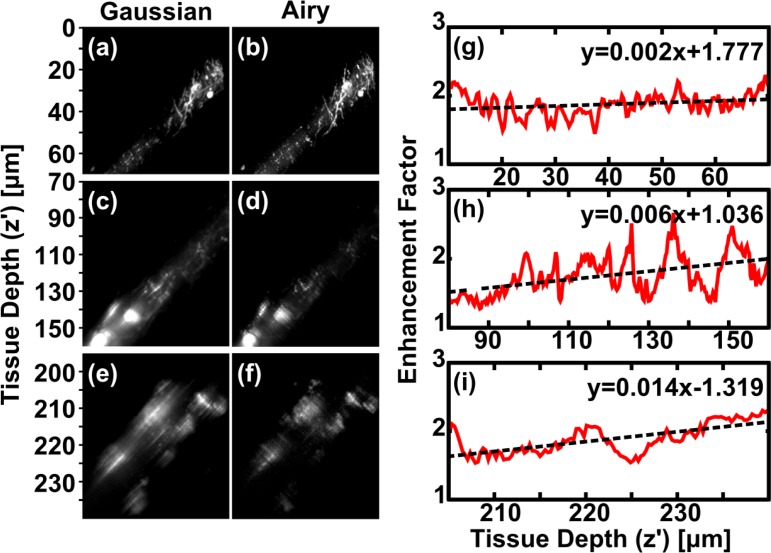
Fig. 5.
Fourier analysis of datasets shown in Fig. 4. (a–f) Cropped and apodized regions within dashed boxes (i–iii) from Fig. 4 acquired with GLSM (left) and ALSM (right). (g–i) High-frequency enhancement factor, EFHF (z′) within dashed boxes (i–iii). Dashed lines in (g–i) are linear fits to the data, equations shown on each plot. This dataset can be accessed at [23].

