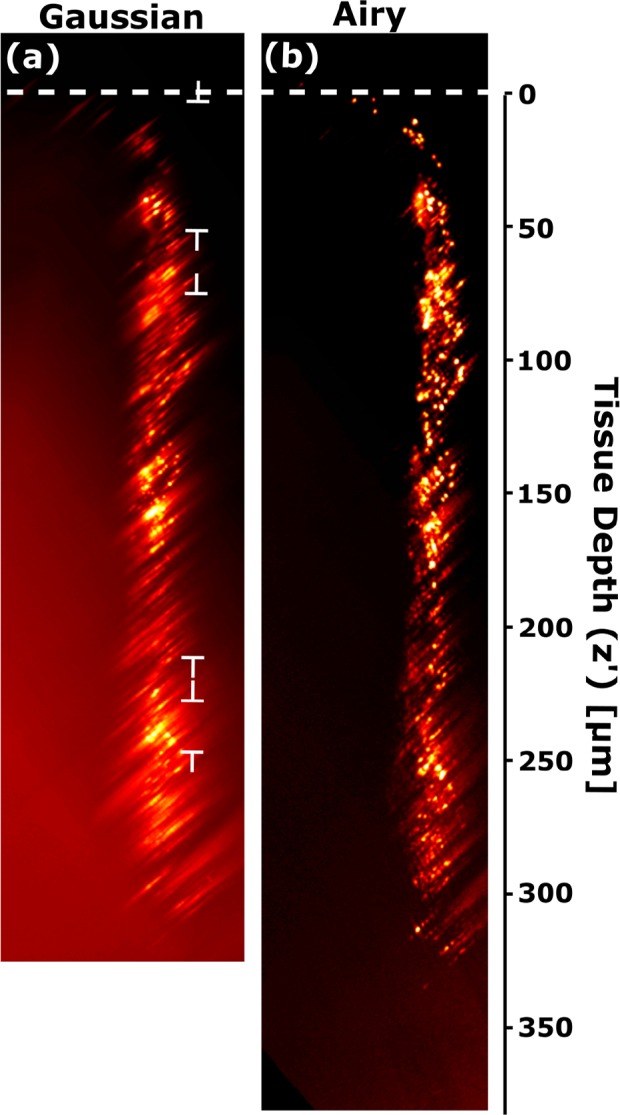
Fig. 6.

Maximum intensity projection (x′ − z′ view) of mouse brain tissue injected with red fluorescent microspheres (diameter 600 nm) and illuminated by (a) GLSM and (b) ALSM. The top of the tissue is indicated by a dashed white line. This dataset can be accessed at [23].
