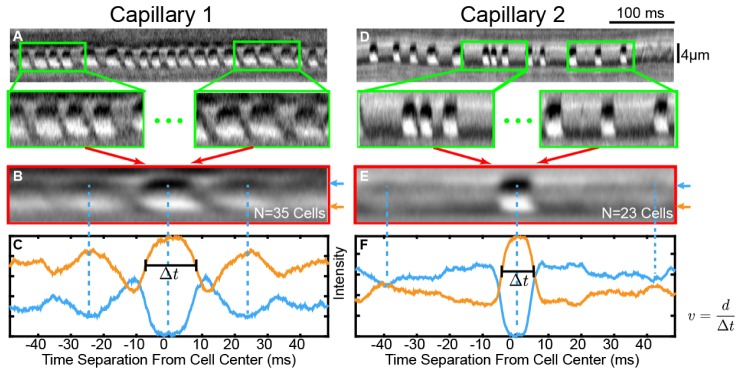
Fig. 6.
A) Line scan image where a moving average window centered on each cell was used to generate its average cell. B) Average cell image corresponding to A where the average target cell is highly visible and because of the regularity in the flow, the average neighboring cells too have appreciable contrast. C) Plot of the pixel intensity of the two lines of the darkest and brightest pixels in the image also marked by the arrows on the right of B and E. The orange plot has a prominent central peak, where the width of the central peak is used to determine cell velocity. There are also slightly less prominent peaks on each side of the central one corresponding to the surrounding cells. D) Line scan image of another capillary with irregular spacing between cells E) Average cell plot corresponding to D where the average target cell is highly visible but because of the lack of regularity in flow, the average neighboring cells have washed out contrast due to temporal variability. F) Linear profile corresponding to the arrows on the right of E. The orange plot has very faint peaks on either side of the central peak.

