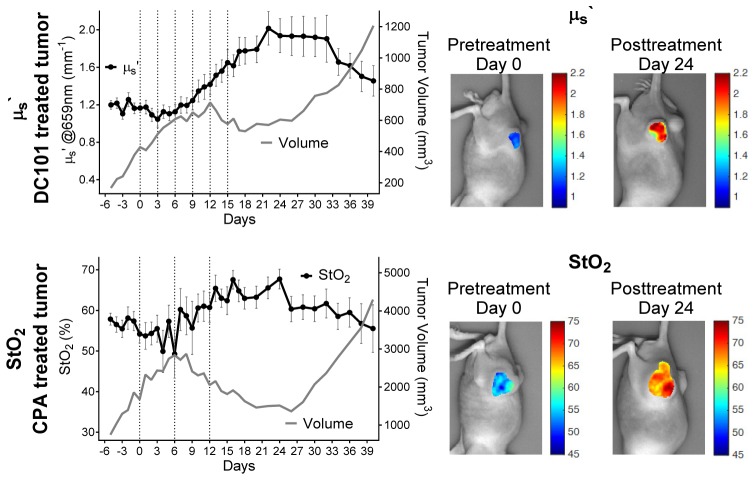
Fig. 6.
μs` (left axis) and tumor volume (right axis) over days of DC101 treated tumor (top left), μs` colormaps overlaid on the DC101 treated planar mouse image at day 0 and day 24 (top right), StO2 (left axis) and tumor volume (right axis) over days for CPA treated tumor (bottom left), StO2 colormaps overlaid on the CPA treated planar mouse image at day 0 and day 24 (bottom right).

