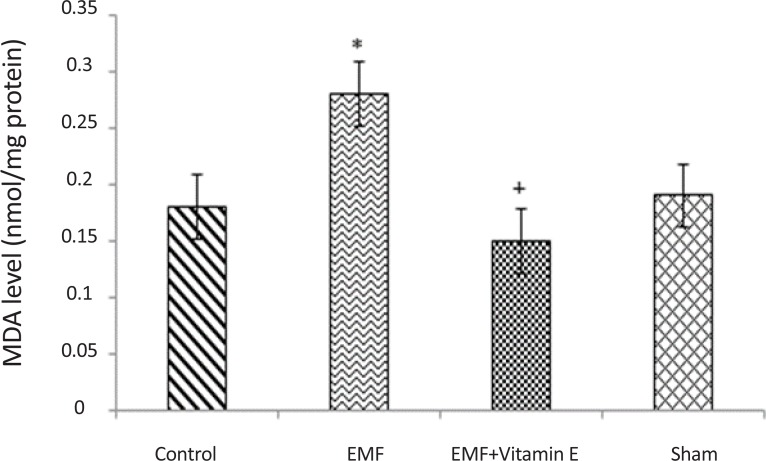
Figure 1.
MDA levels in substantia nigra of rats for each groups. *P<0.05 shows significant difference in comparison with the control group; +P<0.05 shows significant difference in comparison with EMF group. Results are expressed as mean±SD of MDA levels. Statistical analysis was carried out with one-way ANOVA (F=9.214).

