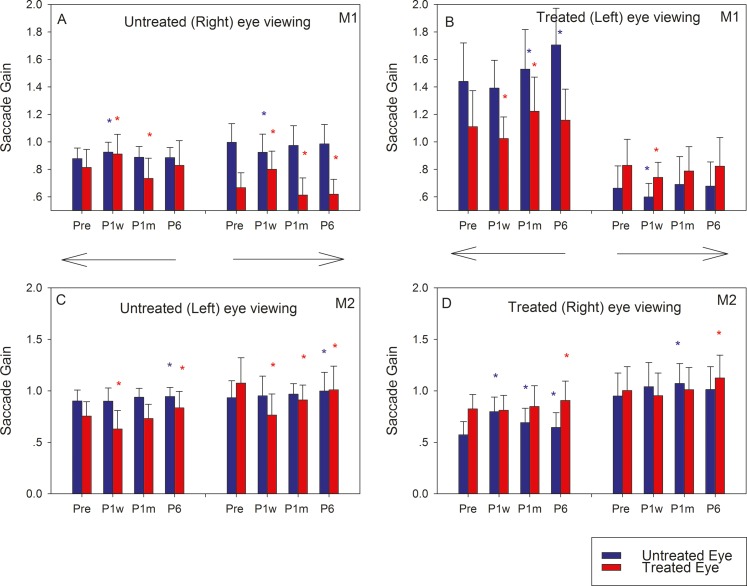
Figure 2.
Longitudinal change in horizontal saccade gains in M1 (A, B) and M2 (C, D) following strabismus treatment. Bars in each plot show means and SDs of saccade gains of the untreated eye (blue) and treated eye (red) at four time points (Pre, P1w, P1m, and P6). Leftward and rightward saccades were analyzed separately and are represented by the directional arrows. The asterisks represent statistically significant difference compared with presurgical values (blue, untreated eye; red, treated eye).

