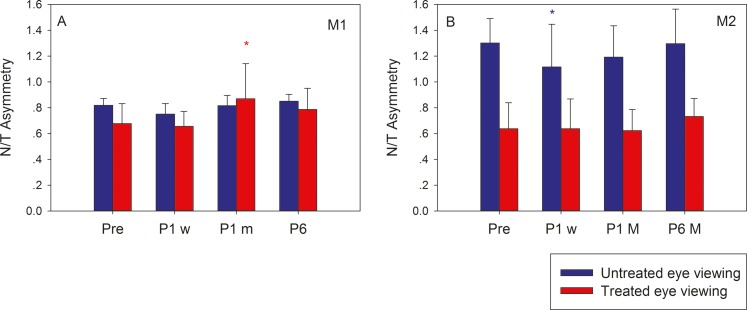
Figure 5.
Longitudinal change in naso-temporal asymmetry following strabismus treatment. Bars in each plot show a naso-temporal asymmetry index calculated as the ratio of the viewing eye temporalward and nasalward smooth-pursuit gain for M1 (A) and M2 (B) at four time points (Pre, P1w, P1m, P6). N/T asymmetry index during untreated eye viewing is shown in blue and during treated eye viewing is shown in red.

