
Figure 2.
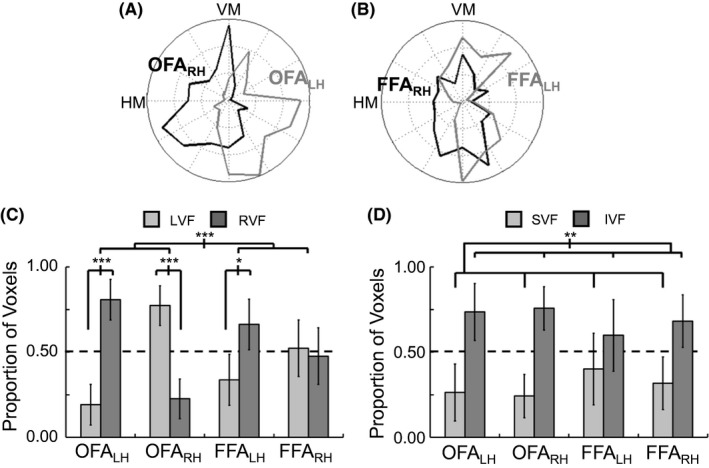
Biases in the lag values for occipital face area (OFA) and fusiform face area (FFA) to nonfacial stimuli. (A) and (B) Distribution of greatest polar angle sensitivity across voxels in the OFA and FFA, respectively, grouped based on left hemisphere (LH) and right hemisphere (RH). (C) Analysis of horizontal visual field bias (left vs. right visual field) based on the relative distribution of lag values across voxels, excluding those with preferred lag values along the vertical meridian (VM). (D) Analysis of vertical visual field bias (superior vs. inferior visual field) based on the relative distribution of lag values across voxels, excluding those with preferred lag values along the horizontal meridian (HM). (error bars = 95% c.i.) (*p < .05, **p < .01, ***p < .001)