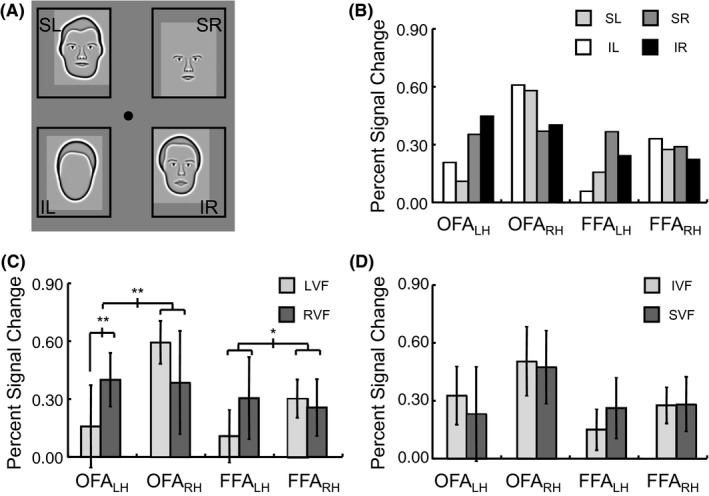
Figure 3.

Facial stimuli and response amplitude to different positions. (A) Example stimuli shown at the four quadrant locations, though a stimulus in only a single quadrant was shown within each block. Analysis was done after collapsing across responses to different types of facial stimuli. (B) Activation to each of the four positions in face‐sensitive regions of interest. (C) Analysis of horizontal visual field bias (SL/IL for LVF vs. SR/IR for RVF) based on the average response within an entire region of interest. (D) Analysis of vertical visual field bias (SL/SR for SVF vs. IL/IR for IVF) based on the average response within an entire region of interest. (error bars = 95% c.i.) (*p < .05, **p < .01, ***p < .001)
