Figure 3.

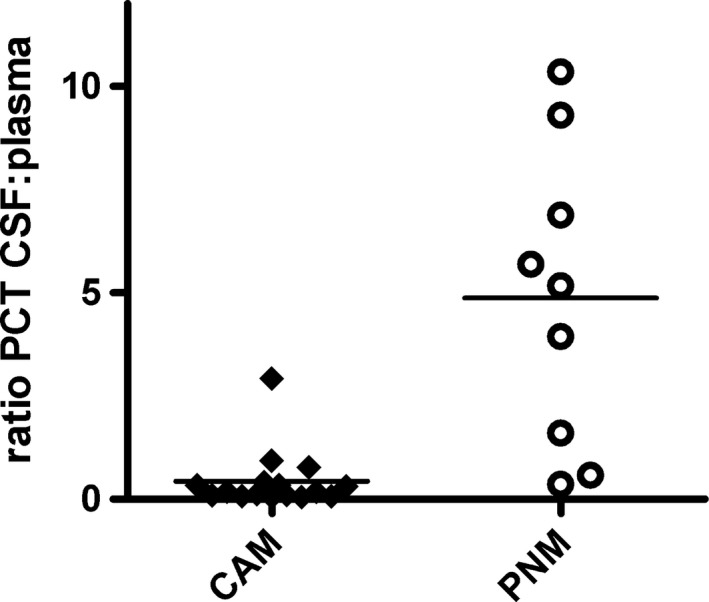
Scatter plots of procalcitonin plasma: cerebrospinal fluid ratio. Horizontal bar represents the mean value of a group, logarithmic scale

Scatter plots of procalcitonin plasma: cerebrospinal fluid ratio. Horizontal bar represents the mean value of a group, logarithmic scale