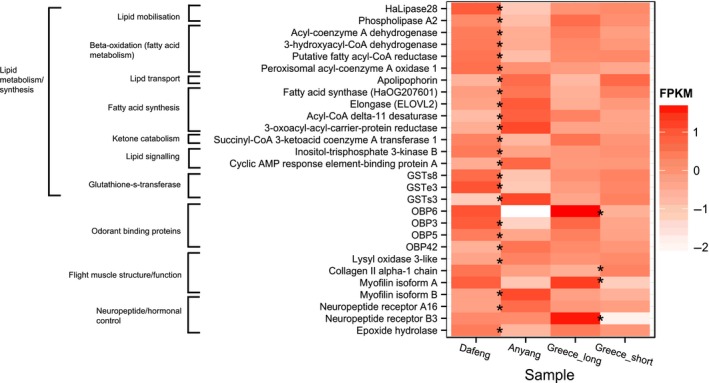
Figure 3.

Differential expression of core genes with an identified role in flight physiology. Heat map of absolute expression measured as normalized FPKM values. Values are given for all genes with differential expression between the flight phenotype comparisons (FDR < 0.1) represented by *. The two flight phenotypes from Greece are marked as ‘Greece long’ and ‘Greece short’.
