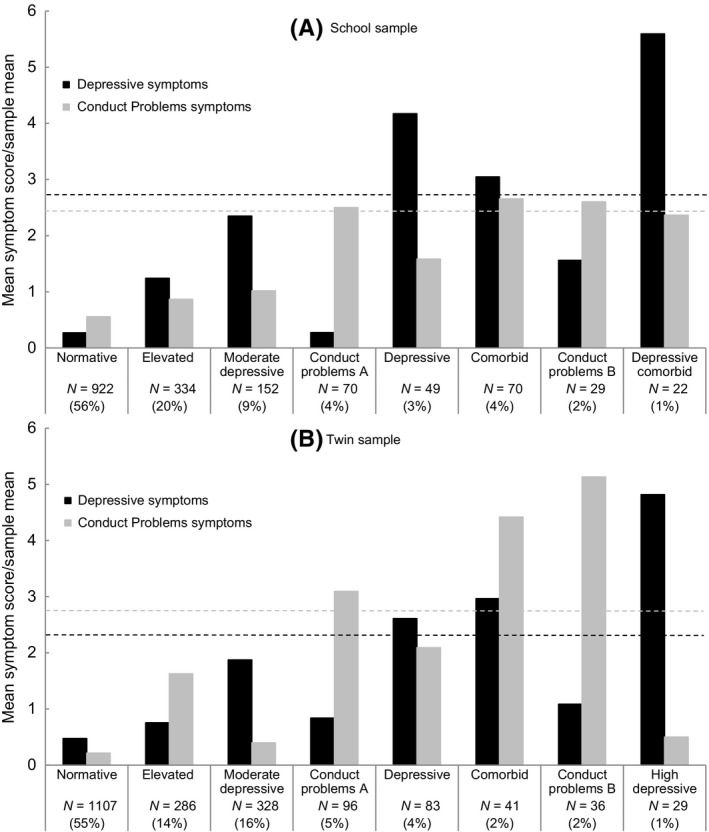
Figure 1.

Depressive symptoms and conduct problems for the eight profiles. Mean depressive symptoms and conduct problems for each profile are presented divided by the sample mean for comparability across samples. Dashed lines represent the equivalent suggested clinical cut‐points for depressive symptoms (11 for the school sample and 21(Angold et al., 2002; Wood et al., 1995) for the twin sample) and the 90th percentile for conduct problems
