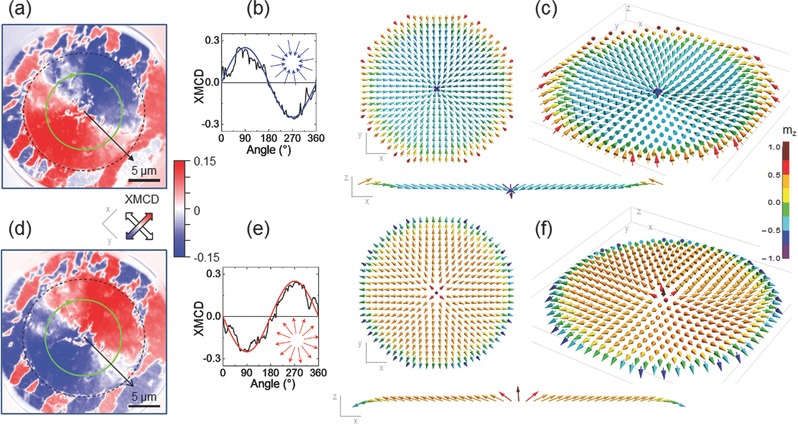
Figure 4.

a) XMCD image of a disk hybrid structure at remanence after a maximum applied field of –30 mT. Dashed line shows the limits of the SC dot. b) XMCD signal along circumference (green solid line in (a)) versus angle. Solid curve shows the expected XMCD versus angle signal for a monopole field, depicted in the inset. c) Micromagnetic simulations showing the 3D spin texture of the Py layer in the disk hybrid structure. d–f) idem at +30 mT.
