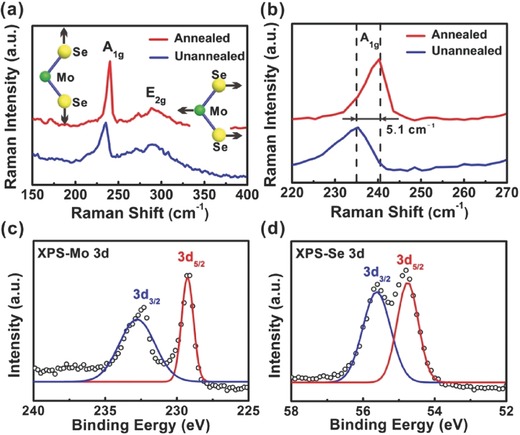
Figure 1.

a) Raman spectra of both as‐prepared and annealed MoSe2 films. Schematic illustrations in (a) depict the atomic vibration direction of A1g (left) and E2g (right) Raman modes of MoSe2 film. b) Comparison of the A1g peaks in Raman spectra for the as‐prepared and annealed MoSe2 films. XPS spectra show the binding energies of c) Mo and d) Se for the annealed MoSe2 film.
