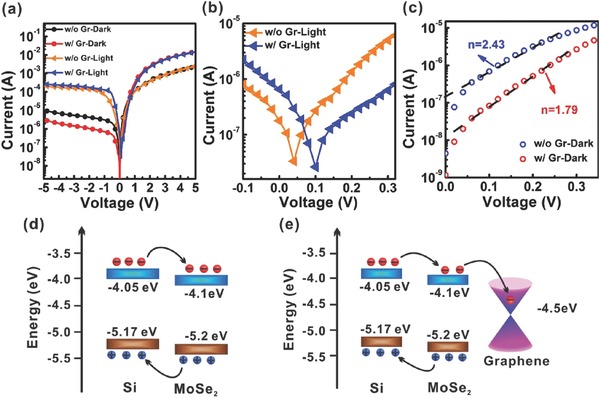
Figure 3.

a) Typical I–V curves of the MoSe2/Si heterojunction with and without graphene transparent electrode measured in dark and under white light illumination (23 mW cm−2), respectively. b) Magnified I–V curves around zero point under light illumination. c) Semilogarithmic I–V curve at forward bias of 0–0.4 V in the dark. The semilogarithmic curves could be fitted by straight lines. Energy band alignments of the MoSe2/Si heterojunctions d) without graphene and e) with graphene transparent electrode. The conduction band minimum (CBM) and the valence band maximum (VBM) of Si and MoSe2 are represented in blue colour and brown colour, respectively. The work function of graphene (4.5 eV) is also shown in black line. The energy scale is referenced to the vacuum level.
