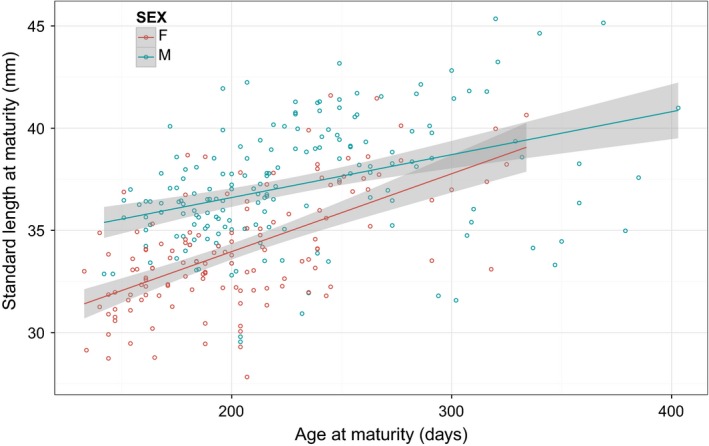
Figure 1.

Observed size (standard length) at maturation as a function of age by sex. Circles denote phenotypic observations (n F = 148, n M = 195) whereas solid lines illustrate predictions from simple linear regressions with shaded areas denoting predicted mean ± SE.
