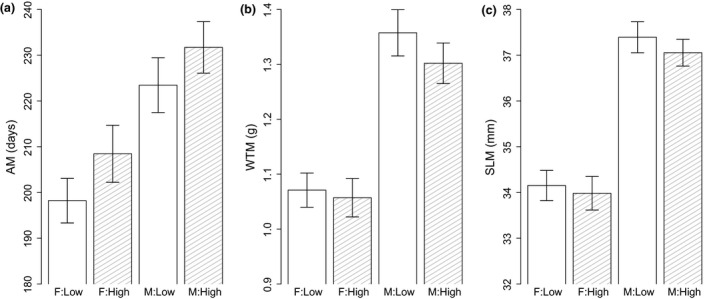
Figure 2.

Mean observed (a) maturation age (AM), (b) weight (MWT) and (c) standard length (MSL) by sex for low‐ and high‐density treatments. White columns denote low (L)‐density treatment and shaded columns indicate high (H)‐density treatment for male (M) and female (F) values with bars showing mean ± SE (n FL = 83, n ML = 92, and n FH = 65, n MH = 103).
