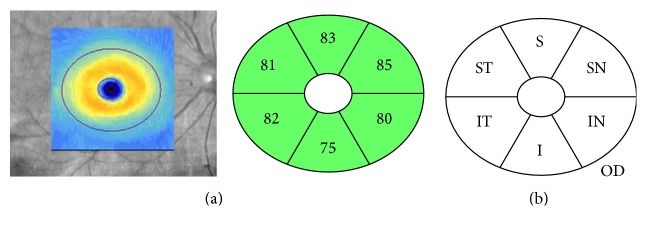
Figure 3.
An example (a) and a schematic diagram (b) of an optical coherence tomography scan of the macular ganglion cell-inner plexiform layer, showing the area of the macula with a 4.0-mm-long × 4.8-mm-wide oval shape (excluding a 1.0-mm × 1.2-mm ellipse), centered on the fovea of the right eye. ST, superotemporal; S, superior; SN, superonasal; IN, inferonasal; I, inferior; IT, inferotemporal; OD, right eye.

