Figure 4.
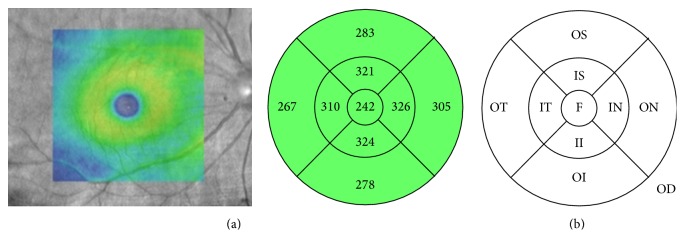
An example (a) and a schematic diagram (b) of a macular optical coherence tomography (OCT) scan showing areas of the fovea with a 1.0-mm concentric diameter, the inner macular area with a 3.0-mm concentric diameter, and the outer macular area with a 6.0-mm concentric diameter. The numbers refer to the average thickness of each macular sector. F, fovea; S, superior; IS, inner superior; OS, outer superior; IN, inner nasal; ON, outer nasal; II, inner inferior; OI, outer inferior; IT, inner temporal; OT, outer temporal; OD, right eye.

