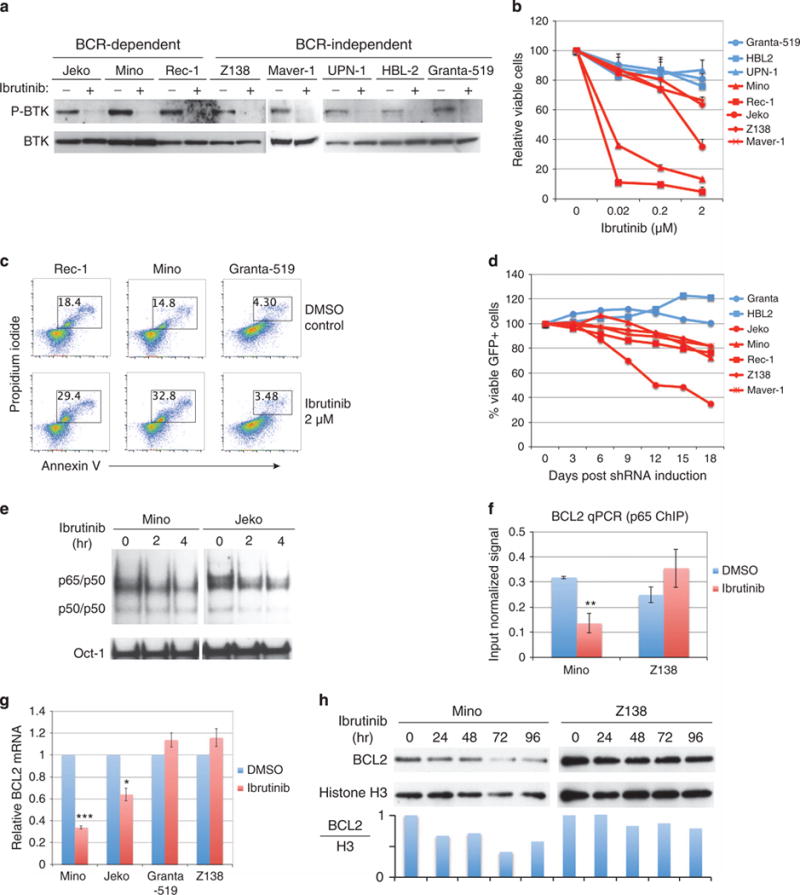
Figure 3.

BTK-mediated canonical NF-κB activation and targeting BTK by ibrutinib in MCL. (a) Immunoblotting analysis of BTK and p-BTK in MCL cell lines. Cells were treated with 10 μM ibrutinib or dimethylsulfoxide control for 15 min. (b) Quantitative measurement of ibrutinib-mediated toxicity by Trypan blue dye exclusion viability assay in the indicated cell lines after 6 days of treatment. Error bars represent mean ± s.d. (n = 3). (c) Flow cytometric analysis of apoptotic cell death by propidium iodide and annexin V co-staining after 6 days of ibrutinib treatment. (d) Flow cytometric analysis of BTK shRNA expressing cells. The percentage of viable GFP+ shBTK expressing cells was normalized to that of the control shRNA for each time point. Data are representative of three independent experiments. (e) Electrophoretic mobility shift assay (EMSA) for NF-κB activity in Mino and Jeko cells when treated with 10 μM ibrutinib. Oct-1 served as a loading control. (f) Chromatin immuneprecipitation (ChIP) assay with anti-p65 antibody in Mino and Z138 cells after 6 h of treatment with 2 μM ibrutinib. The occupancy of p65 on BCL2 promoter region was determined by standard qPCR. IgG antibody served as a negative control and the signal from IgG ChIP was negligible. (g) Measurement of BCL2 mRNA by qPCR in the indicated MCL cell lines after 24 h of treatment with 2 μM ibrutinib. Error bars represent mean ± s.d. of triplicates (*P<0.05, ***P<0.001). (h) Measurement of BCL2 protein in Mino and Z138 cells after treatment with 10 μM ibrutinib for the indicated times.
