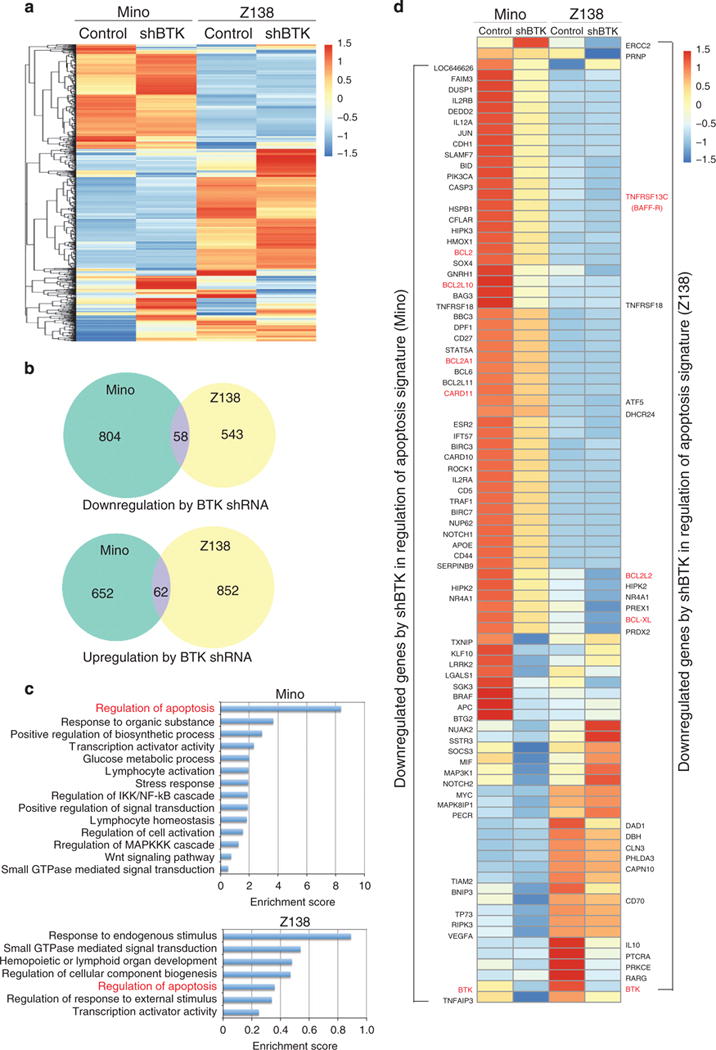
Figure 6.

RNA-seq analysis reveals distinct sets of genes regulated by shBTK between Mino and Z138 cells. (a) A heatmap of differentially expressed genes in untreated (control) and shBTK-treated (shRTK) Mino and Z138 cells. The gene expression (RPKM) values for each gene were normalized to the standard normal distribution to generate Z-scores. The color bar indicates expression levels from low in blue to high in red. (b) Venn diagrams showing the overlap of downregulated genes (upper panel) and upregulated genes (bottom panel) between Mino and Z138 cells. (c) Enrichment for ontological categories. (d) A heatmap shows distinct apoptosis-associated genes downregulated by shBTK in Mino and Z138 cells. The complete gene lists for a to d are provided in Supplementary Tables 1c–1f.
