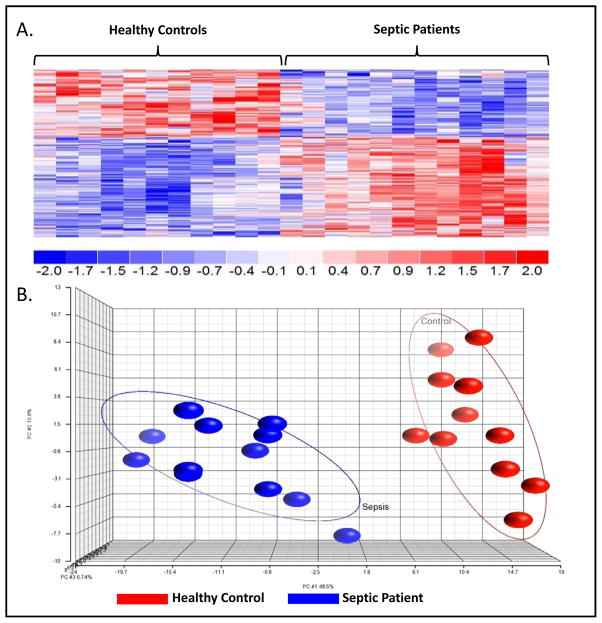
Figure 3. Severe Sepsis/Septic Shock Patient and Healthy Control Subject Gene Expression.
Using a false discovery adjusted probability of <0.001 and a two-fold difference in expression, the temporal pattern of the expression of the sepsis responsive genes differed between MDSCs from the healthy control (HC) subjects and severe sepsis/septic shock (SS/SS) patients. A. There was a significant difference in the expression of 257 genes between MDSCs isolated from SS/SS patients and HC subjects (p <0.001). B. Principle Component Analysis (PCA) of the gene expression from the 257 genes demonstrates the overall differences in the patterns of gene expression. Gene expression patterns from HC subjects (red) are tightly grouped to the right and the SS/SS patients (blue) are tightly grouped to the left. The tight grouping and lack of overlap of data points reflects the significant difference between the two groups.

