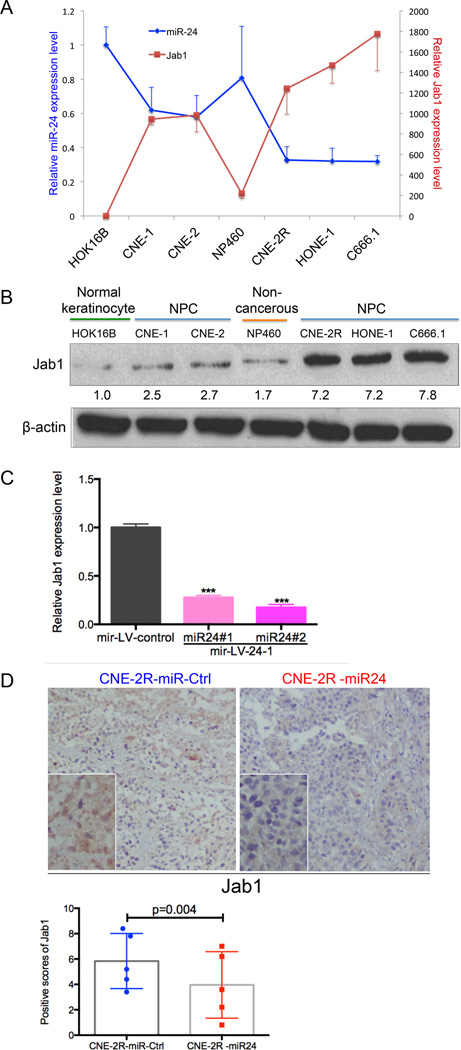
Figure 4.
Inverse correlation between the expression level of Jab1 and miR-24 both in vitro and in vivo. (A) Double y-axis diagram represented the relative miR-24 and Jab1 mRNA expression levels in seven cell lines: HOK16B, NP460, CNE-1, CNE-2, CNE-2R, HONE-1, and C666.1. U6 snRNA was used as an endogenous control for miR-24. Results are presented as the means ± s.d. of three independent experiments. (B) Western blotting assay of Jab1 protein level in seven cell lines: HOK16B, NP460, CNE-1, CNE-2, CNE-2R, HONE-1, and C666.1. Protein levels were quantified using ImageJ software. (C) qRT-PCR results for the Jab1 mRNA levels in the cells stably overexpressing miR-24. Data represent means ± s.d. of three independent experiments. ***P < 0.0001, Student’s t-test. (D) Representative pictures of Jab1 expression in the tissues resected from mice injected with cells overexpressing miR-24 or not (top panel). The bottom panel shows positive scores of Jab1 expression in the tissues resected from mice injected with CNE-2R overexpressing miR-24 or not. P = 0.004, Student’s t-test.

